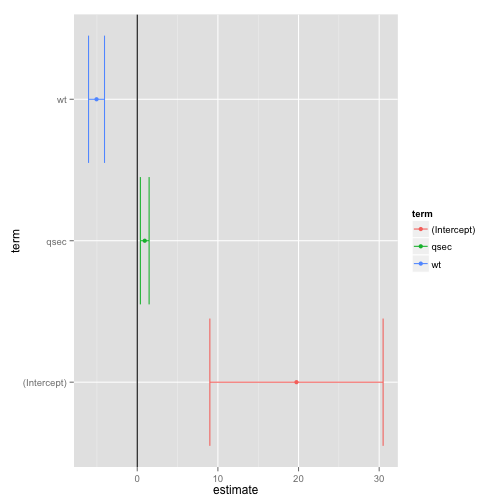
We perform a simple linear fit:
fit <- lm(mpg ~ wt + qsec, mtcars)Then broom makes it easy to create a coefficient plot with ggplot2:
library(broom)
td <- tidy(fit, conf.int = TRUE)

library(ggplot2)
ggplot(td, aes(estimate, term, color = term)) +
    geom_point() +
    geom_errorbarh(aes(xmin = conf.low, xmax = conf.high)) +
    geom_vline()